How to Add a Dashboard to Google Analytics
To add and customize Google Analytics Dashboard, head over to Customization > Dashboards.
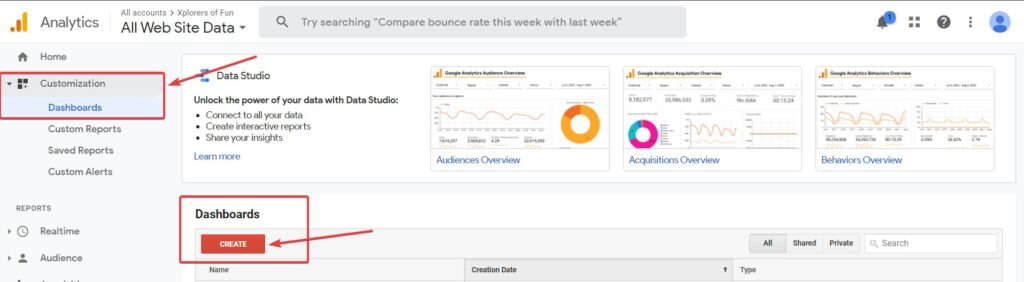
After that, click on ‘Create’.
Now, you will have to select between a blank canvas or a starter dashboard template.
For this tutorial, we will start with a blank canvas. Enter the name for the Google Analytics dashboard and click on ‘Create Dashboard’.
Adding and Customizing Widgets
Now, we will have to add widgets.
Widgets are the different metrics you would like to track. I will show you the different types of widgets later, but for now, let’s see how to add one.
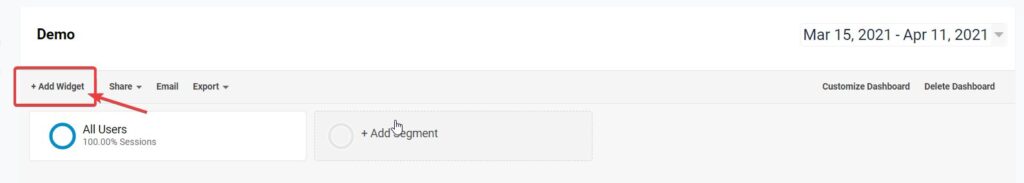
To add a widget, click the Add Widget button in the top menu, and a popup will appear.
Here, you’ll have to enter the metric you want to track. First, we’ll start tracking the New Users. Here are the steps to add the widget:
- First, add your widget title.
- Now select the type of widget. The types of widgets are metric, timeline, geomap, table, pie and bar.
Let’s go over them one by one:
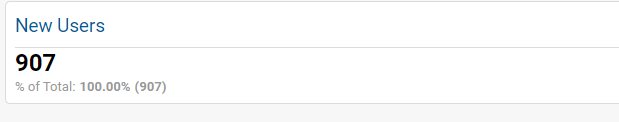
Metric
Shows the exact number.
For Eg: If the number of users for a week has been 200, then the metric only shows the number. Here’s an example:
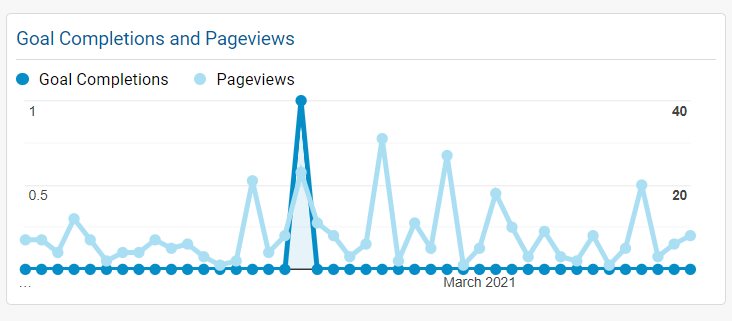
Timeline
This shows a line graph of your data. You can even compare two metrics over time with it!
Example:
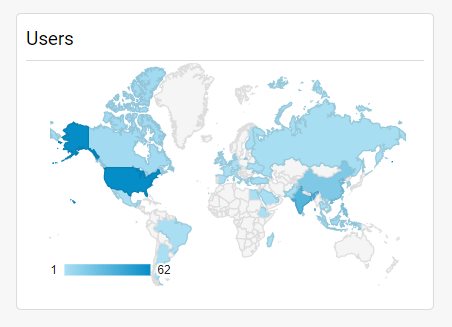
Geomap
As the name suggests, this metric divides your data by country. If we are tracking new users, then choosing this will show new users by country, like this:
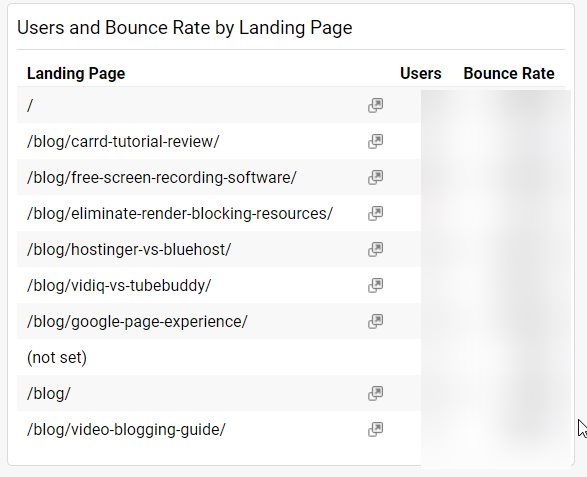
Table
The table widget shows your data as a table. That’s pretty easy to understand
Pie
Pie represents your data in the form of a pie chart.
Bar Chart
The bar represents your data in the form of a bar graph.
Now that you have understood this, you can create your own widgets!
Building your own dashboard from scratch takes time, so I have built some templates to help you save more time and improve your data analysis! Just scroll down to access them for free!
Plus, you can edit them all!
How to Share Your Dashboard
You’ll need to share your dashboard with whomever you report to.
To share it, click the Share button on the top ribbon.
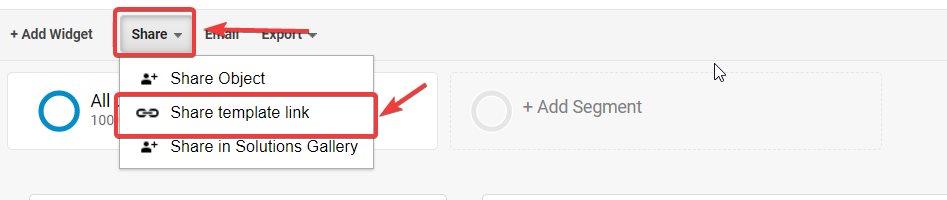
Now, click on ‘Generate template link’.
This will generate the link to the template, and now you can share it anywhere!
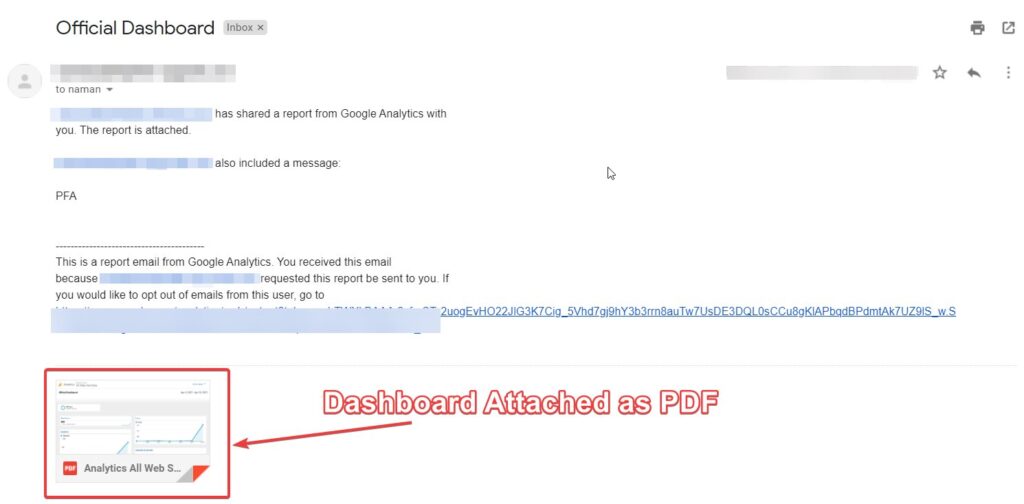
How to Get Weekly Emails From Google Analytics
GA sends you a weekly email with all your data. Here’s how the email looks:
So, to set this up, click the ‘Email’ Button on the top ribbon.
Next, enter the email address you want to send the report to.
After that, enter the email subject and the body content.
In the frequency section, you must select when to send this report. It can be once, daily, weekly, monthly, etc.
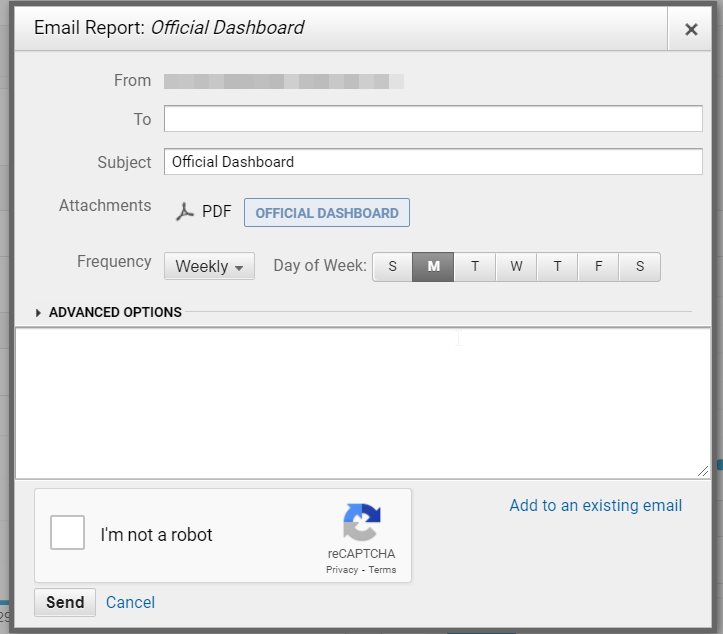
Once you are done, click on send! Now, you’ll receive these reports as you configured them!
How to delete your dashboard
If you want to delete your dashboard, that’s pretty easy too!
Just click on the Delete Dashboard button at the top!
Google Analytics Dashboard Templates
So, now I will show you some dashboard templates you can use for free! They will be for different purposes, like user experience, content marketing and so on! Let’s start!
1. Social Media Marketing Template
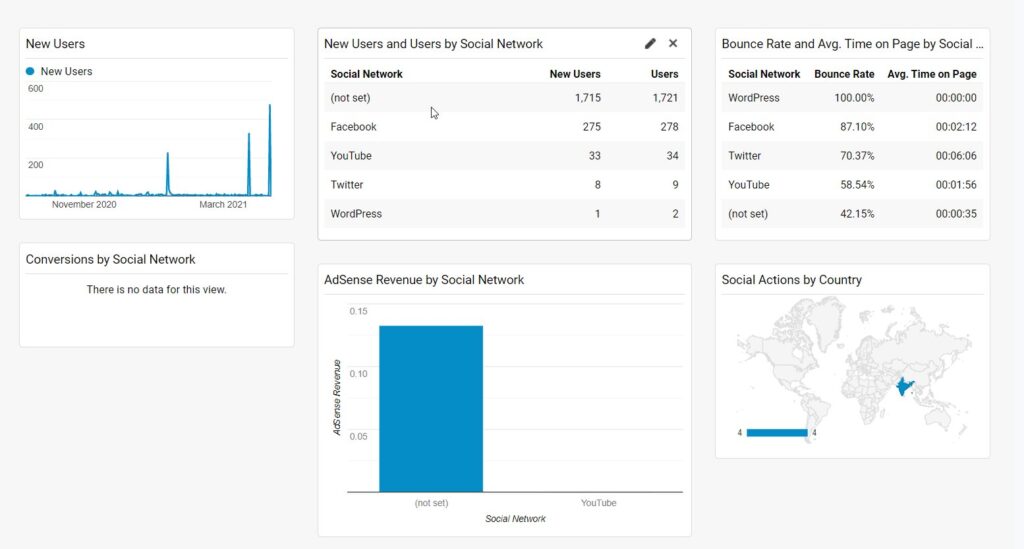
This template highlights a social media campaign’s basic KPIs (Key Performance Indicators). In this dashboard, you can see the users, bounce rate, revenue, etc., by social network. Great for tracking your social progress over time!
2. Content Marketing Template
This content marketing template will help you identify your top pages, traffic sources, and conversions and give you an overall idea of your content marketing efforts. This shows you which country converts well for you and where you should focus more!
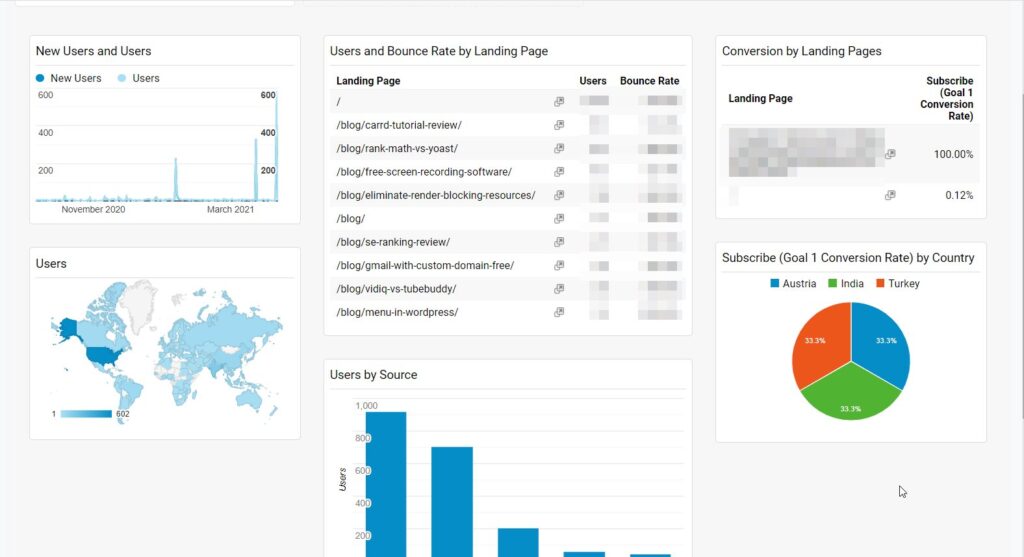
3. SEO Dashboard Tenplate
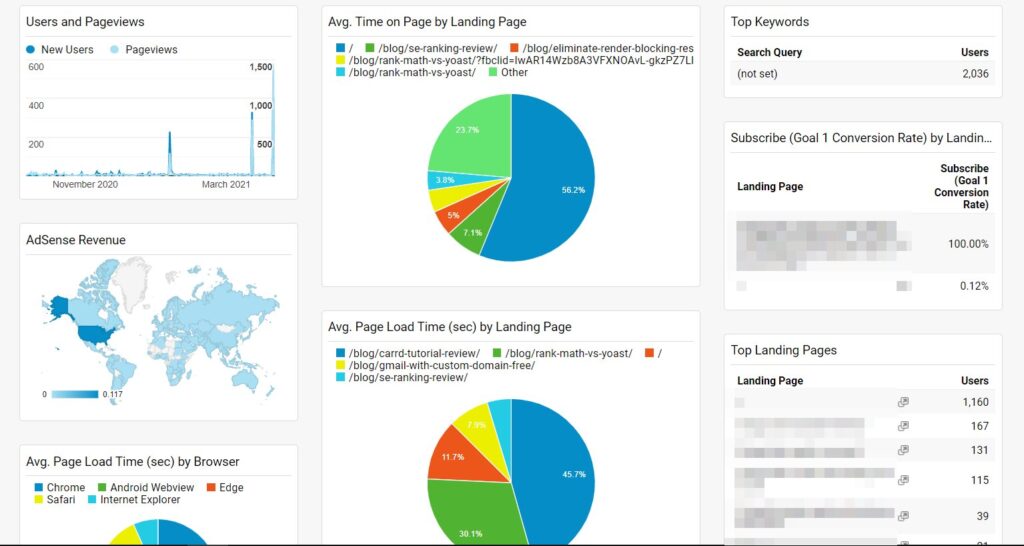
This SEO Dashboard shows you your traffic over time, page load times, keywords, conversion rate and also Adsense revenue!
It’s great for measuring your SEO performance over time!
Conclusion
So that was how you can customize and create a Google Analytics dashboard.
I also included templates for you to get started quickly! These custom dashboards will help you analyze your data faster and take better decisions!
Leave a comment below telling how you utilize Google Analytics dashboards in your marketing!
Subscribe to my newsletter for more great tutorials!